Hispanic unemployment rate in California exceeds that of blacks
Hispanic unemployment in California, which has been rising rapidly, reached 15.7% in the quarter ending June 30, exceeding African American joblessness for the first time in the current economic downturn, according to a new analysis.
The state’s Latino unemployment is projected to hit nearly 18% a year from now, says the report released Monday by the Economic Policy Institute, a Washington-based think tank.
Nationally, black unemployment continues to surpass Hispanic joblessness and that pattern is not expected to change soon, according to Algernon Austin, the study’s author. Still, across the country, unemployment among Hispanics has increased faster than for other groups.
Among 12 states with enough data to compare unemployment by ethnicity, California is the only one where Hispanic joblessness leads all other groups.
“One thing that is driving the Hispanic unemployment rate is the collapse of the housing market, which means the collapse of construction,” Austin said. “That has been a big factor.”
But in California, it is Hispanic women who appear to be tipping the unemployment scales. Latino female unemployment began overtaking that of black women earlier this year, according to Austin’s data. Black males still have higher unemployment in the state than Hispanic males. “Construction is certainly part of the story,” he said, “but I don’t think it’s the full story” of Latino job losses.
As the recession took hold in late 2007, black unemployment in California was 9.8%, compared with 7% for Hispanics and 4.6% for whites, the report says. For the second quarter of this year, black unemployment is estimated at 15.3% — slightly less than Hispanics — and white unemployment was 8.6%.
Source: L.A. Times – Rich Connell
https://hispanic-marketing.com/wp-content/uploads/2014/09/targetlatino-enfold-logo1.png00Havi Goffanhttps://hispanic-marketing.com/wp-content/uploads/2014/09/targetlatino-enfold-logo1.pngHavi Goffan2009-07-30 11:27:382018-03-27 04:22:44Hispanic unemployment rate in California exceeding AA
U.S. Population Projections: 2005–2050 – What will the U.S. look like in 2050?
U.S. Population Projections: 2005–2050
What will the U.S. look like in 2050? Population and Immigration
Between 2005 and 2050, the nation’s population will increase to 438 million from 296 million, a rise of 142 million people that represents growth of 48%.
Immigrants who arrive after 2005, and their U.S.-born descendants, account for 82% of the projected national population increase during the 2005–2050 period.
Of the 117 additional people attributable to the effect of new immigration, 67 million will be the immigrants themselves and 50 million will be their U.S.-born children and grandchildren
The nation’s foreign-born population, 36 million in 2005, is projected to rise to 81 million in 2050, growth of 129%.
In 2050, nearly one in five Americans (19%) will be an immigrant, compared with one in eight now (12% in 2005).
• The foreign-born share of the nation’s population will exceed historic highs sometime between 2020 and 2025, when it reaches 15%. The historic peak share was 14.7% in 1910 and 14.8% in 1890.
• Births in the United States will play a growing role in Hispanic and Asian population growth, so a diminishing proportion of both groups will be foreign-born.
What will the U.S. look like in 2050? Racial and Ethnic Groups
• The Hispanic population, 42 million in 2005, will rise to 128 million in 2050, tripling in size. Latinos will be 29% of the population, compared with 14% in 2005. Latinos will account for 60% of the nation’s population growth from 2005 to 2050.
• The black population, 38 million in 2005, will grow to 59 million in 2050, a rise of 56%. In 2050, the nation’s population will be 13.4% black, compared with 12.8% in 2005.
• The Asian population, 14 million in 2005, will grow to 41 million in 2050, nearly tripling in size. In 2050, the nation’s population will be 9% Asian, compared with 5% in 2005. Most Asians in the United States were foreign born in 2005 (58%), but by 2050, fewer than half (47%) will be.
• The white, non-Hispanic population, 199 million in 2005, will grow to 207 million in 2050, a 4% increase. In 2050, 47% of the U.S. population will be non-Hispanic white, compared with 67% in 2005.
What will the U.S. look like in 2050? Age Groups
• The working-age population—adults ages 18 to 64—will reach 255 million in 2050, up from 186 million in 2005. This segment will grow more slowly over the projection period (37%) than the overall population. Future immigrants and their descendants will account for all growth in this group.
• Among working-age adults, the foreign-born share, 15% in 2005, will rise to 23% in 2050. The Hispanic share, 14% in 2005, will increase to 31% in 2050. The non-Hispanic white share, 68% in 2005, will decline to 45% in 2050.
• The nation’s population of children ages 17 and younger will rise to 102 million in 2050, up from 73 million in 2005. The child population will grow more slowly in future decades (39%) than will the overall population. Future immigrants and their descendants will account for all growth in this population segment.
• Among children, the share who are immigrants or who have an immigrant parent will rise to 34% in 2050 from 23% in 2005. The share of children who are Hispanic, 20% in 2005, will rise to 35% in 2050. Non-Hispanic whites, who make up 59% of today’s children, will be 40% of children in 2050.
• The nation’s elderly population— people ages 65 and older—will grow to 81 million in 2050, up from 37 million in 2005. This group will grow more rapidly than the overall population, so its share will increase to 19% in 2050, from 12% in 2005. Immigration will account for only a small part of that growth.
• The dependency ratio—the number of people of working age, compared with the number of young and elderly—will rise sharply, mainly because of growth in the elderly population. There were 59 children and elderly people per 100 adults of working age in 2005. That will rise to 72 dependents per 100 adults of working age in 2050.
What will the U.S. look like in 2050? Alternative Projection Scenarios
• Under a lower-immigration scenario, the total population would rise to 384 million, the foreign-born share would stabilize at 13% and the Hispanic share would go up to 26% in 2050.
• Under a higher-immigration scenario, the total population would rise to 496 million, the foreign-born share would rise to 23% and the Hispanic share would go up to 32% in 2050.
• Under a lower- or higher-immigration scenario, the dependency ratio would range from 75 dependents per 100 people of working age to 69 dependents per 100 people of working age. Both of these ratios are well above the current value of 59 dependents per 100 people of working age.
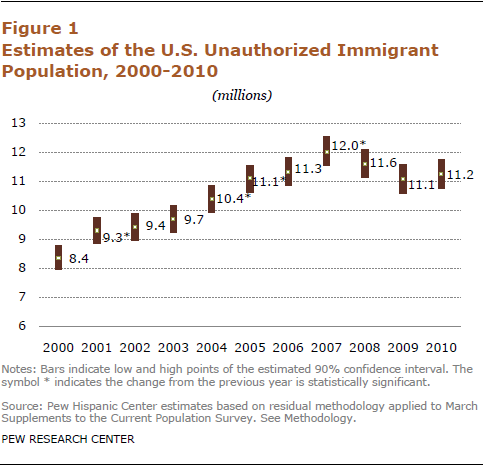
https://hispanic-marketing.com/wp-content/uploads/2011/02/2011-unauthorized-immigration-01.png465484Havi Goffanhttps://hispanic-marketing.com/wp-content/uploads/2014/09/targetlatino-enfold-logo1.pngHavi Goffan2011-02-01 12:18:262018-03-27 00:52:03Unauthorized Immigrant Population: National and State Trends
https://hispanic-marketing.com/wp-content/uploads/2010/05/cuba.jpg315600Havi Goffanhttps://hispanic-marketing.com/wp-content/uploads/2014/09/targetlatino-enfold-logo1.pngHavi Goffan2010-05-18 09:38:412018-03-28 05:36:17Have you heard about Cubans?
https://hispanic-marketing.com/wp-content/uploads/2010/05/PuertoRicanCoqui.jpg349509Havi Goffanhttps://hispanic-marketing.com/wp-content/uploads/2014/09/targetlatino-enfold-logo1.pngHavi Goffan2010-05-17 09:06:042018-03-28 05:37:00What are Puerto Ricans like?
https://hispanic-marketing.com/wp-content/uploads/2010/03/1104507_mobile_phone.jpg300225Havi Goffanhttps://hispanic-marketing.com/wp-content/uploads/2014/09/targetlatino-enfold-logo1.pngHavi Goffan2010-04-07 09:08:462019-08-13 04:13:54How Young Latinos Come of Age in America
Source: Pew Research Center – 2008
https://hispanic-marketing.com/wp-content/uploads/2009/07/year-2050.jpg400600Havi Goffanhttps://hispanic-marketing.com/wp-content/uploads/2014/09/targetlatino-enfold-logo1.pngHavi Goffan2009-07-24 08:56:022018-05-18 19:40:07What will the U.S. look like in 2050?
Hispanic unemployment rate in California exceeds that of blacks
Hispanic unemployment in California, which has been rising rapidly, reached 15.7% in the quarter ending June 30, exceeding African American joblessness for the first time in the current economic downturn, according to a new analysis.
The state’s Latino unemployment is projected to hit nearly 18% a year from now, says the report released Monday by the Economic Policy Institute, a Washington-based think tank.
Nationally, black unemployment continues to surpass Hispanic joblessness and that pattern is not expected to change soon, according to Algernon Austin, the study’s author. Still, across the country, unemployment among Hispanics has increased faster than for other groups.
Among 12 states with enough data to compare unemployment by ethnicity, California is the only one where Hispanic joblessness leads all other groups.
“One thing that is driving the Hispanic unemployment rate is the collapse of the housing market, which means the collapse of construction,” Austin said. “That has been a big factor.”
But in California, it is Hispanic women who appear to be tipping the unemployment scales. Latino female unemployment began overtaking that of black women earlier this year, according to Austin’s data. Black males still have higher unemployment in the state than Hispanic males. “Construction is certainly part of the story,” he said, “but I don’t think it’s the full story” of Latino job losses.
As the recession took hold in late 2007, black unemployment in California was 9.8%, compared with 7% for Hispanics and 4.6% for whites, the report says. For the second quarter of this year, black unemployment is estimated at 15.3% — slightly less than Hispanics — and white unemployment was 8.6%.
Source: L.A. Times – Rich Connell
https://hispanic-marketing.com/wp-content/uploads/2014/09/targetlatino-enfold-logo1.png00Havi Goffanhttps://hispanic-marketing.com/wp-content/uploads/2014/09/targetlatino-enfold-logo1.pngHavi Goffan2009-07-30 11:27:382018-03-27 04:22:44Hispanic unemployment rate in California exceeding AA
U.S. Population Projections: 2005–2050 – What will the U.S. look like in 2050?
U.S. Population Projections: 2005–2050
What will the U.S. look like in 2050? Population and Immigration
Between 2005 and 2050, the nation’s population will increase to 438 million from 296 million, a rise of 142 million people that represents growth of 48%.
Immigrants who arrive after 2005, and their U.S.-born descendants, account for 82% of the projected national population increase during the 2005–2050 period.
Of the 117 additional people attributable to the effect of new immigration, 67 million will be the immigrants themselves and 50 million will be their U.S.-born children and grandchildren
The nation’s foreign-born population, 36 million in 2005, is projected to rise to 81 million in 2050, growth of 129%.
In 2050, nearly one in five Americans (19%) will be an immigrant, compared with one in eight now (12% in 2005).
• The foreign-born share of the nation’s population will exceed historic highs sometime between 2020 and 2025, when it reaches 15%. The historic peak share was 14.7% in 1910 and 14.8% in 1890.
• Births in the United States will play a growing role in Hispanic and Asian population growth, so a diminishing proportion of both groups will be foreign-born.
What will the U.S. look like in 2050? Racial and Ethnic Groups
• The Hispanic population, 42 million in 2005, will rise to 128 million in 2050, tripling in size. Latinos will be 29% of the population, compared with 14% in 2005. Latinos will account for 60% of the nation’s population growth from 2005 to 2050.
• The black population, 38 million in 2005, will grow to 59 million in 2050, a rise of 56%. In 2050, the nation’s population will be 13.4% black, compared with 12.8% in 2005.
• The Asian population, 14 million in 2005, will grow to 41 million in 2050, nearly tripling in size. In 2050, the nation’s population will be 9% Asian, compared with 5% in 2005. Most Asians in the United States were foreign born in 2005 (58%), but by 2050, fewer than half (47%) will be.
• The white, non-Hispanic population, 199 million in 2005, will grow to 207 million in 2050, a 4% increase. In 2050, 47% of the U.S. population will be non-Hispanic white, compared with 67% in 2005.
What will the U.S. look like in 2050? Age Groups
• The working-age population—adults ages 18 to 64—will reach 255 million in 2050, up from 186 million in 2005. This segment will grow more slowly over the projection period (37%) than the overall population. Future immigrants and their descendants will account for all growth in this group.
• Among working-age adults, the foreign-born share, 15% in 2005, will rise to 23% in 2050. The Hispanic share, 14% in 2005, will increase to 31% in 2050. The non-Hispanic white share, 68% in 2005, will decline to 45% in 2050.
• The nation’s population of children ages 17 and younger will rise to 102 million in 2050, up from 73 million in 2005. The child population will grow more slowly in future decades (39%) than will the overall population. Future immigrants and their descendants will account for all growth in this population segment.
• Among children, the share who are immigrants or who have an immigrant parent will rise to 34% in 2050 from 23% in 2005. The share of children who are Hispanic, 20% in 2005, will rise to 35% in 2050. Non-Hispanic whites, who make up 59% of today’s children, will be 40% of children in 2050.
• The nation’s elderly population— people ages 65 and older—will grow to 81 million in 2050, up from 37 million in 2005. This group will grow more rapidly than the overall population, so its share will increase to 19% in 2050, from 12% in 2005. Immigration will account for only a small part of that growth.
• The dependency ratio—the number of people of working age, compared with the number of young and elderly—will rise sharply, mainly because of growth in the elderly population. There were 59 children and elderly people per 100 adults of working age in 2005. That will rise to 72 dependents per 100 adults of working age in 2050.
What will the U.S. look like in 2050? Alternative Projection Scenarios
• Under a lower-immigration scenario, the total population would rise to 384 million, the foreign-born share would stabilize at 13% and the Hispanic share would go up to 26% in 2050.
• Under a higher-immigration scenario, the total population would rise to 496 million, the foreign-born share would rise to 23% and the Hispanic share would go up to 32% in 2050.
• Under a lower- or higher-immigration scenario, the dependency ratio would range from 75 dependents per 100 people of working age to 69 dependents per 100 people of working age. Both of these ratios are well above the current value of 59 dependents per 100 people of working age.
https://hispanic-marketing.com/wp-content/uploads/2011/02/2011-unauthorized-immigration-01.png465484Havi Goffanhttps://hispanic-marketing.com/wp-content/uploads/2014/09/targetlatino-enfold-logo1.pngHavi Goffan2011-02-01 12:18:262018-03-27 00:52:03Unauthorized Immigrant Population: National and State Trends
https://hispanic-marketing.com/wp-content/uploads/2010/05/cuba.jpg315600Havi Goffanhttps://hispanic-marketing.com/wp-content/uploads/2014/09/targetlatino-enfold-logo1.pngHavi Goffan2010-05-18 09:38:412018-03-28 05:36:17Have you heard about Cubans?
https://hispanic-marketing.com/wp-content/uploads/2010/05/PuertoRicanCoqui.jpg349509Havi Goffanhttps://hispanic-marketing.com/wp-content/uploads/2014/09/targetlatino-enfold-logo1.pngHavi Goffan2010-05-17 09:06:042018-03-28 05:37:00What are Puerto Ricans like?
https://hispanic-marketing.com/wp-content/uploads/2010/03/1104507_mobile_phone.jpg300225Havi Goffanhttps://hispanic-marketing.com/wp-content/uploads/2014/09/targetlatino-enfold-logo1.pngHavi Goffan2010-04-07 09:08:462019-08-13 04:13:54How Young Latinos Come of Age in America
Source: Pew Research Center – 2008
https://hispanic-marketing.com/wp-content/uploads/2009/07/year-2050.jpg400600Havi Goffanhttps://hispanic-marketing.com/wp-content/uploads/2014/09/targetlatino-enfold-logo1.pngHavi Goffan2009-07-24 08:56:022018-05-18 19:40:07What will the U.S. look like in 2050?
In January 2007, the Smithfield Plant in Tar Heel, N.C. was raided by Immigration and Customs Enforcement (ICE). This raid drastically changed the demographics of the plant, shifting from a mostly illegal Hispanic workforce to a legal African American workforce. The plant’s workers were able to unionize in the aftermath, something the previous workforce had failed to do twice prior to the raid.
Jerry Kammer, Senior Research Fellow at the Center for Immigration Studies, has examined the circumstances surrounding the raid and the plant’s unionization. In “Immigration Raids at Smithfield: How an ICE Enforcement Action Boosted Union Organizing and the Employment of American Workers,” Kammer gives an overview of events before the unionization and insights into the varied reasons workers were able to solidify backing for the union. The report is online at http://cis.org/SmithfieldImmigrationRaid-Unionization.
The sequence of events includes:
The Smithfield Plant, represented by the United Food and Commercial Workers Union (UFCW), failed to unionize in both 1994 and 1997. An administrative law judge found that the company committed “egregious and pervasive violations of labor law” during the 1997 effort when it used the employees’ illegal status to threaten them.
After the initial attempts at unionizing, Smithfield and the UFCW engaged in a bitter dispute. The union launched a public relations campaign and picketed Smithfield customers. Smithfield, in return, filed a federal racketeering lawsuit against the union.
The ICE raid, which took place in January 2007, both purged the plant of illegal workers and forced the management to set procedures to check immigration status of future hires.
The raid opened the door for an American and legal immigrant workforce. After the raid, the Hispanic workforce dropped by approximately 1,000 workers and was replaced by mostly African American workers. Less than two years later, in December 2008, the new workforce voted for unionization.
The Center for Immigration Studies is an independent research institute that examines the impact of immigration on the United States.
Source: Center for Immigration Studies
https://hispanic-marketing.com/wp-content/uploads/2014/09/targetlatino-enfold-logo1.png00Target Latinohttps://hispanic-marketing.com/wp-content/uploads/2014/09/targetlatino-enfold-logo1.pngTarget Latino2009-07-21 18:32:222018-03-27 04:32:39Immigration Raids and Union Organizing
The nation’s largest minority group controlled $686 billion in spending in 2004, the University of Georgia’s Selig Center for Economic Growth concluded, and the Hispanic purchasing power comprises the world’s ninth biggest economy. It’s larger than the GNP of Brazil, Spain or Mexico, reported the Hispanic Association on Corporate Responsibility. Hispanic purchasing power is projected to reach as much as $1 trillion by next year (2010).
The main drivers of the surge in Hispanic consumer influence are education levels, labor force composition, household characteristics and accumulation of wealth.
Advertising expenditures aimed at U.S. Hispanics have grown while the overall ad market has slowed down. From 2000-2004, Latino-directed budgets from the top 50 advertisers rose from $658 million to $1.23 billion, or 87%. Major players such as Procter & Gamble, General Motors, McDonald’s and Coca-Cola have continually increased the amount they spend to reach this coveted market, which is becoming more desirable in terms of sheer numbers and economic clout.
• U.S. Hispanic purchasing power posted a compound annual growth rate of 7.7%
• Higher paying managerial and professional jobs are the fastest-growing occupational categories for Hispanics
• California and Texas account for more than 34 percent of all Hispanic purchasing power and nearly half of the entire U.S. Hispanic population
Source: TIA
https://hispanic-marketing.com/wp-content/uploads/2014/09/targetlatino-enfold-logo1.png00Havi Goffanhttps://hispanic-marketing.com/wp-content/uploads/2014/09/targetlatino-enfold-logo1.pngHavi Goffan2009-07-17 16:31:402018-03-27 05:04:56Hispanic Purchasing Power is world’s 9th biggest economy
During the last six years the number of Hispanic registered voters in Georgia has risen by more than 1,300 percent and Hispanics now comprise 3 percent of the state’s voters, a recent study found.
“Where we started with about 10,000 Latino registered voters back in January 2003, now we have 146,000 approximately,” said Jerry Gonzalez, executive director of the Georgia Association of Latino Elected Officials and author of a report on Hispanic voter participation.
“I think voter turnout is a true indicator that there has been great success in encouraging the Latino community to vote,” he said. “In the majority of the jurisdictions across the state, Latino voter participation outpaced national rates in the general election.”
In Whitfield County, the number of registered Hispanic voters rose 331 percent between 2003 and 2009, the study showed. Whitfield now ranks sixth among Georgia’s 159 counties in the number of Hispanic registered voters in Georgia, with 3,015. The highest concentration of self-identified Hispanic registered voters is in Gwinnett County, with 15,593, according to the report.
But the growth of the Hispanic electorate will be gradual, said Dr. David Boyle, dean of the School of Social work at Dalton State College. He is a co-author of “Voices of the Nueva Frontera,” a book about Hispanic immigration to the Dalton area.
“Many of the community-based groups are working very hard with citizenship education, to encourage people to follow through and get their citizenship so they can vote, but it’s very slow,” he said. “There’s not going to be any huge leap or change, I don’t think any type of balance in terms of the electoral mix.”
America Gruner, founder of the Coalition of Latino Leaders in Dalton, said the study’s findings are a result of a long process.
“In 2006 CLILA found that, despite the hostile rhetoric (anti-immigration sentiment in some campaigns), many Latinos in the area were apathetic or felt discouraged because in their countries of origin the political decisions are not made democratically or corruption reigns,” she said.
The coalition started a voter education campaign alongside its registration efforts, she said.
Whitfield County Registrar Kay Staten said she has noticed more Hispanics registering to vote, but nothing too dramatic.
“We have a pretty large Hispanic community in Dalton, and the children who are growing up are getting closer to voting age, so it will probably rise some as they get older,” she said.
About 40 percent of the population in Dalton is Hispanic, according to Census 2000 figures.
Mr. Gonzalez said that despite their overall small numbers, Hispanic voters can make a difference in close elections. He said it’s important for candidates to start courting that vote.
“I think that particularly for the governor’s race in Georgia, it looks like it’s going to be a competitive race, both in the primary as well in the general election,” he said.
“It would make prudent sense for candidates to look at the Latino electorate as a viable force to be considered and courted, not as a campaign tactic to be used to bash immigrants,” he said.
BY THE NUMBERS
Self-identified Hispanic registered voters in Whitfield County:
* 699 — January, 2003
* 1,317 — December, 2004
* 1,907 — November, 2007
* 2,603 — October, 2008
* 3,015 — June, 2009
*331 percent — growth rate from January, 2003 to June, 2009
Source: Georgia Association of Latino Elected Officials
CITIZENSHIP RECOGNITION
In a ceremony during the Fourth of July celebration in Dalton, Ga., 31 new citizens were recognized by Mayor David Pennington, Whitfield County Commission Chairman Mike Babb and other community leaders.
Source: Perla Trevizo
https://hispanic-marketing.com/wp-content/uploads/2014/09/targetlatino-enfold-logo1.png00Havi Goffanhttps://hispanic-marketing.com/wp-content/uploads/2014/09/targetlatino-enfold-logo1.pngHavi Goffan2009-07-10 11:13:542018-03-27 05:34:19State’s Hispanic electorate on the rise
We may request cookies to be set on your device. We use cookies to let us know when you visit our websites, how you interact with us, to enrich your user experience, and to customize your relationship with our website.
Click on the different category headings to find out more. You can also change some of your preferences. Note that blocking some types of cookies may impact your experience on our websites and the services we are able to offer.
Essential Website Cookies
These cookies are strictly necessary to provide you with services available through our website and to use some of its features.
Because these cookies are strictly necessary to deliver the website, refusing them will have impact how our site functions. You always can block or delete cookies by changing your browser settings and force blocking all cookies on this website. But this will always prompt you to accept/refuse cookies when revisiting our site.
We fully respect if you want to refuse cookies but to avoid asking you again and again kindly allow us to store a cookie for that. You are free to opt out any time or opt in for other cookies to get a better experience. If you refuse cookies we will remove all set cookies in our domain.
We provide you with a list of stored cookies on your computer in our domain so you can check what we stored. Due to security reasons we are not able to show or modify cookies from other domains. You can check these in your browser security settings.
Google Analytics Cookies
These cookies collect information that is used either in aggregate form to help us understand how our website is being used or how effective our marketing campaigns are, or to help us customize our website and application for you in order to enhance your experience.
If you do not want that we track your visit to our site you can disable tracking in your browser here:
Other external services
We also use different external services like Google Webfonts, Google Maps, and external Video providers. Since these providers may collect personal data like your IP address we allow you to block them here. Please be aware that this might heavily reduce the functionality and appearance of our site. Changes will take effect once you reload the page.
Google Webfont Settings:
Google Map Settings:
Google reCaptcha Settings:
Vimeo and Youtube video embeds:
Other cookies
The following cookies are also needed - You can choose if you want to allow them:
Privacy Policy
You can read about our cookies and privacy settings in detail on our Privacy Policy Page.