What will the U.S. look like in 2050?

U.S. Population Projections: 2005–2050 – What will the U.S. look like in 2050?
U.S. Population Projections: 2005–2050
What will the U.S. look like in 2050? Population and Immigration
Between 2005 and 2050, the nation’s population will increase to 438 million from 296 million, a rise of 142 million people that represents growth of 48%.
Immigrants who arrive after 2005, and their U.S.-born descendants, account for 82% of the projected national population increase during the 2005–2050 period.
Of the 117 additional people attributable to the effect of new immigration, 67 million will be the immigrants themselves and 50 million will be their U.S.-born children and grandchildren
The nation’s foreign-born population, 36 million in 2005, is projected to rise to 81 million in 2050, growth of 129%.
In 2050, nearly one in five Americans (19%) will be an immigrant, compared with one in eight now (12% in 2005).
• The foreign-born share of the nation’s population will exceed historic highs sometime between 2020 and 2025, when it reaches 15%. The historic peak share was 14.7% in 1910 and 14.8% in 1890.
• Births in the United States will play a growing role in Hispanic and Asian population growth, so a diminishing proportion of both groups will be foreign-born.
What will the U.S. look like in 2050? Racial and Ethnic Groups
• The Hispanic population, 42 million in 2005, will rise to 128 million in 2050, tripling in size. Latinos will be 29% of the population, compared with 14% in 2005. Latinos will account for 60% of the nation’s population growth from 2005 to 2050.
• The black population, 38 million in 2005, will grow to 59 million in 2050, a rise of 56%. In 2050, the nation’s population will be 13.4% black, compared with 12.8% in 2005.
• The Asian population, 14 million in 2005, will grow to 41 million in 2050, nearly tripling in size. In 2050, the nation’s population will be 9% Asian, compared with 5% in 2005. Most Asians in the United States were foreign born in 2005 (58%), but by 2050, fewer than half (47%) will be.
• The white, non-Hispanic population, 199 million in 2005, will grow to 207 million in 2050, a 4% increase. In 2050, 47% of the U.S. population will be non-Hispanic white, compared with 67% in 2005.
What will the U.S. look like in 2050? Age Groups
• The working-age population—adults ages 18 to 64—will reach 255 million in 2050, up from 186 million in 2005. This segment will grow more slowly over the projection period (37%) than the overall population. Future immigrants and their descendants will account for all growth in this group.
• Among working-age adults, the foreign-born share, 15% in 2005, will rise to 23% in 2050. The Hispanic share, 14% in 2005, will increase to 31% in 2050. The non-Hispanic white share, 68% in 2005, will decline to 45% in 2050.
• The nation’s population of children ages 17 and younger will rise to 102 million in 2050, up from 73 million in 2005. The child population will grow more slowly in future decades (39%) than will the overall population. Future immigrants and their descendants will account for all growth in this population segment.
• Among children, the share who are immigrants or who have an immigrant parent will rise to 34% in 2050 from 23% in 2005. The share of children who are Hispanic, 20% in 2005, will rise to 35% in 2050. Non-Hispanic whites, who make up 59% of today’s children, will be 40% of children in 2050.
• The nation’s elderly population— people ages 65 and older—will grow to 81 million in 2050, up from 37 million in 2005. This group will grow more rapidly than the overall population, so its share will increase to 19% in 2050, from 12% in 2005. Immigration will account for only a small part of that growth.
• The dependency ratio—the number of people of working age, compared with the number of young and elderly—will rise sharply, mainly because of growth in the elderly population. There were 59 children and elderly people per 100 adults of working age in 2005. That will rise to 72 dependents per 100 adults of working age in 2050.
What will the U.S. look like in 2050? Alternative Projection Scenarios
• Under a lower-immigration scenario, the total population would rise to 384 million, the foreign-born share would stabilize at 13% and the Hispanic share would go up to 26% in 2050.
• Under a higher-immigration scenario, the total population would rise to 496 million, the foreign-born share would rise to 23% and the Hispanic share would go up to 32% in 2050.
• Under a lower- or higher-immigration scenario, the dependency ratio would range from 75 dependents per 100 people of working age to 69 dependents per 100 people of working age. Both of these ratios are well above the current value of 59 dependents per 100 people of working age.
 https://hispanic-marketing.com/wp-content/uploads/2011/02/2011-unauthorized-immigration-01.png
465
484
Havi Goffan
https://hispanic-marketing.com/wp-content/uploads/2014/09/targetlatino-enfold-logo1.png
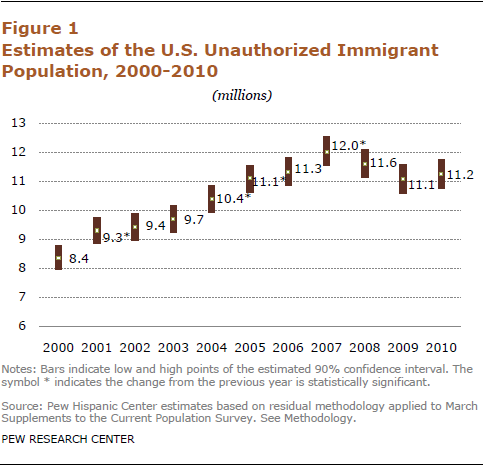
Havi Goffan2011-02-01 12:18:262018-03-27 00:52:03Unauthorized Immigrant Population: National and State Trends
https://hispanic-marketing.com/wp-content/uploads/2011/02/2011-unauthorized-immigration-01.png
465
484
Havi Goffan
https://hispanic-marketing.com/wp-content/uploads/2014/09/targetlatino-enfold-logo1.png
Havi Goffan2011-02-01 12:18:262018-03-27 00:52:03Unauthorized Immigrant Population: National and State Trends https://hispanic-marketing.com/wp-content/uploads/2010/05/el-salvador.jpg
271
500
Havi Goffan
https://hispanic-marketing.com/wp-content/uploads/2014/09/targetlatino-enfold-logo1.png
Havi Goffan2010-05-26 09:49:512018-03-28 05:34:46Let’s talk about Salvadorans
https://hispanic-marketing.com/wp-content/uploads/2010/05/el-salvador.jpg
271
500
Havi Goffan
https://hispanic-marketing.com/wp-content/uploads/2014/09/targetlatino-enfold-logo1.png
Havi Goffan2010-05-26 09:49:512018-03-28 05:34:46Let’s talk about Salvadorans https://hispanic-marketing.com/wp-content/uploads/2010/05/cuba.jpg
315
600
Havi Goffan
https://hispanic-marketing.com/wp-content/uploads/2014/09/targetlatino-enfold-logo1.png
Havi Goffan2010-05-18 09:38:412018-03-28 05:36:17Have you heard about Cubans?
https://hispanic-marketing.com/wp-content/uploads/2010/05/cuba.jpg
315
600
Havi Goffan
https://hispanic-marketing.com/wp-content/uploads/2014/09/targetlatino-enfold-logo1.png
Havi Goffan2010-05-18 09:38:412018-03-28 05:36:17Have you heard about Cubans? https://hispanic-marketing.com/wp-content/uploads/2010/05/PuertoRicanCoqui.jpg
349
509
Havi Goffan
https://hispanic-marketing.com/wp-content/uploads/2014/09/targetlatino-enfold-logo1.png
Havi Goffan2010-05-17 09:06:042018-03-28 05:37:00What are Puerto Ricans like?
https://hispanic-marketing.com/wp-content/uploads/2010/05/PuertoRicanCoqui.jpg
349
509
Havi Goffan
https://hispanic-marketing.com/wp-content/uploads/2014/09/targetlatino-enfold-logo1.png
Havi Goffan2010-05-17 09:06:042018-03-28 05:37:00What are Puerto Ricans like? https://hispanic-marketing.com/wp-content/uploads/2010/03/1104507_mobile_phone.jpg
300
225
Havi Goffan
https://hispanic-marketing.com/wp-content/uploads/2014/09/targetlatino-enfold-logo1.png
Havi Goffan2010-04-07 09:08:462019-08-13 04:13:54How Young Latinos Come of Age in America
https://hispanic-marketing.com/wp-content/uploads/2010/03/1104507_mobile_phone.jpg
300
225
Havi Goffan
https://hispanic-marketing.com/wp-content/uploads/2014/09/targetlatino-enfold-logo1.png
Havi Goffan2010-04-07 09:08:462019-08-13 04:13:54How Young Latinos Come of Age in AmericaSource: Pew Research Center – 2008