U.S. Population Projections: 2005–2050 – What will the U.S. look like in 2050?
U.S. Population Projections: 2005–2050
What will the U.S. look like in 2050? Population and Immigration
Between 2005 and 2050, the nation’s population will increase to 438 million from 296 million, a rise of 142 million people that represents growth of 48%.
Immigrants who arrive after 2005, and their U.S.-born descendants, account for 82% of the projected national population increase during the 2005–2050 period.
Of the 117 additional people attributable to the effect of new immigration, 67 million will be the immigrants themselves and 50 million will be their U.S.-born children and grandchildren
The nation’s foreign-born population, 36 million in 2005, is projected to rise to 81 million in 2050, growth of 129%.
In 2050, nearly one in five Americans (19%) will be an immigrant, compared with one in eight now (12% in 2005).
• The foreign-born share of the nation’s population will exceed historic highs sometime between 2020 and 2025, when it reaches 15%. The historic peak share was 14.7% in 1910 and 14.8% in 1890.
• Births in the United States will play a growing role in Hispanic and Asian population growth, so a diminishing proportion of both groups will be foreign-born.
What will the U.S. look like in 2050? Racial and Ethnic Groups
• The Hispanic population, 42 million in 2005, will rise to 128 million in 2050, tripling in size. Latinos will be 29% of the population, compared with 14% in 2005. Latinos will account for 60% of the nation’s population growth from 2005 to 2050.
• The black population, 38 million in 2005, will grow to 59 million in 2050, a rise of 56%. In 2050, the nation’s population will be 13.4% black, compared with 12.8% in 2005.
• The Asian population, 14 million in 2005, will grow to 41 million in 2050, nearly tripling in size. In 2050, the nation’s population will be 9% Asian, compared with 5% in 2005. Most Asians in the United States were foreign born in 2005 (58%), but by 2050, fewer than half (47%) will be.
• The white, non-Hispanic population, 199 million in 2005, will grow to 207 million in 2050, a 4% increase. In 2050, 47% of the U.S. population will be non-Hispanic white, compared with 67% in 2005.
What will the U.S. look like in 2050? Age Groups
• The working-age population—adults ages 18 to 64—will reach 255 million in 2050, up from 186 million in 2005. This segment will grow more slowly over the projection period (37%) than the overall population. Future immigrants and their descendants will account for all growth in this group.
• Among working-age adults, the foreign-born share, 15% in 2005, will rise to 23% in 2050. The Hispanic share, 14% in 2005, will increase to 31% in 2050. The non-Hispanic white share, 68% in 2005, will decline to 45% in 2050.
• The nation’s population of children ages 17 and younger will rise to 102 million in 2050, up from 73 million in 2005. The child population will grow more slowly in future decades (39%) than will the overall population. Future immigrants and their descendants will account for all growth in this population segment.
• Among children, the share who are immigrants or who have an immigrant parent will rise to 34% in 2050 from 23% in 2005. The share of children who are Hispanic, 20% in 2005, will rise to 35% in 2050. Non-Hispanic whites, who make up 59% of today’s children, will be 40% of children in 2050.
• The nation’s elderly population— people ages 65 and older—will grow to 81 million in 2050, up from 37 million in 2005. This group will grow more rapidly than the overall population, so its share will increase to 19% in 2050, from 12% in 2005. Immigration will account for only a small part of that growth.
• The dependency ratio—the number of people of working age, compared with the number of young and elderly—will rise sharply, mainly because of growth in the elderly population. There were 59 children and elderly people per 100 adults of working age in 2005. That will rise to 72 dependents per 100 adults of working age in 2050.
What will the U.S. look like in 2050? Alternative Projection Scenarios
• Under a lower-immigration scenario, the total population would rise to 384 million, the foreign-born share would stabilize at 13% and the Hispanic share would go up to 26% in 2050.
• Under a higher-immigration scenario, the total population would rise to 496 million, the foreign-born share would rise to 23% and the Hispanic share would go up to 32% in 2050.
• Under a lower- or higher-immigration scenario, the dependency ratio would range from 75 dependents per 100 people of working age to 69 dependents per 100 people of working age. Both of these ratios are well above the current value of 59 dependents per 100 people of working age.
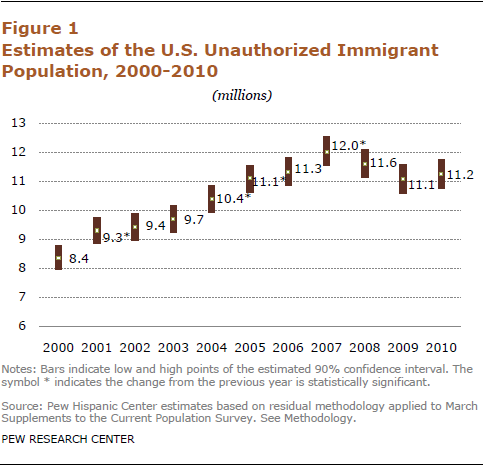
https://hispanic-marketing.com/wp-content/uploads/2011/02/2011-unauthorized-immigration-01.png465484Havi Goffanhttps://hispanic-marketing.com/wp-content/uploads/2014/09/targetlatino-enfold-logo1.pngHavi Goffan2011-02-01 12:18:262018-03-27 00:52:03Unauthorized Immigrant Population: National and State Trends
https://hispanic-marketing.com/wp-content/uploads/2010/05/cuba.jpg315600Havi Goffanhttps://hispanic-marketing.com/wp-content/uploads/2014/09/targetlatino-enfold-logo1.pngHavi Goffan2010-05-18 09:38:412018-03-28 05:36:17Have you heard about Cubans?
https://hispanic-marketing.com/wp-content/uploads/2010/05/PuertoRicanCoqui.jpg349509Havi Goffanhttps://hispanic-marketing.com/wp-content/uploads/2014/09/targetlatino-enfold-logo1.pngHavi Goffan2010-05-17 09:06:042018-03-28 05:37:00What are Puerto Ricans like?
https://hispanic-marketing.com/wp-content/uploads/2010/03/1104507_mobile_phone.jpg300225Havi Goffanhttps://hispanic-marketing.com/wp-content/uploads/2014/09/targetlatino-enfold-logo1.pngHavi Goffan2010-04-07 09:08:462019-08-13 04:13:54How Young Latinos Come of Age in America
Source: Pew Research Center – 2008
https://hispanic-marketing.com/wp-content/uploads/2009/07/year-2050.jpg400600Havi Goffanhttps://hispanic-marketing.com/wp-content/uploads/2014/09/targetlatino-enfold-logo1.pngHavi Goffan2009-07-24 08:56:022018-05-18 19:40:07What will the U.S. look like in 2050?
In September 1968, Congress authorized President Lyndon B. Johnson to proclaim National Hispanic Heritage Week, which was observed during the week that included Sept. 15 and Sept. 16. The observance was expanded in 1988 to a month long celebration (Sept. 15 – Oct. 15). America celebrates the culture and traditions of those who trace their roots to Spain, Mexico and the Spanish-speaking nations of Central America, South America and the Caribbean. Sept. 15 was chosen as the starting point for the celebration because it is the anniversary of independence of five Latin American countries: Costa Rica, El Salvador, Guatemala, Honduras and Nicaragua. In addition, Mexico and Chile celebrate their independence days on Sept. 16 and Sept. 18, respectively.
Population
46.9 million
The estimated Hispanic population of the United States as of July 1, 2008, making people of Hispanic origin the nation’s largest ethnic or race minority. Hispanics constituted 15 percent of the nation’s total population. In addition, there are approximately 4 million residents of Puerto Rico.
Source: Population estimates http://www.census.gov/Press-Release/nas/content/live/hispanic/releases/archives/population/013733.html and http://www.census.gov/Press-Release/nas/content/live/hispanic/releases/archives/population/013049.html
More than 1
…of every two people added to the nation’s population between July 1, 2007, and July 1, 2008, was Hispanic. There were 1.5 million Hispanics added to the population during the period.
Source: Population estimates http://www.census.gov/Press-Release/nas/content/live/hispanic/releases/archives/population/013733.html
3.2%
Percentage increase in the Hispanic population between July 1, 2007, and July 1, 2008, making Hispanics the fastest-growing minority group.
Source: Population estimates http://www.census.gov/Press-Release/nas/content/live/hispanic/releases/archives/population/013733.html
132.8 million
The projected Hispanic population of the United States on July 1, 2050. According to this projection, Hispanics will constitute 30 percent of the nation’s population by that date.
Source: Population projections http://www.census.gov/Press-Release/nas/content/live/hispanic/releases/archives/population/012496.html
22.4 million
The nation’s Hispanic population during the 1990 Census — less than half the current total.
Source: The Hispanic Population: 2000 http://www.census.gov/prod/2001pubs/c2kbr01-3.pdf
2nd
Ranking of the size of the U.S. Hispanic population worldwide, as of 2008. Only Mexico (110 million) had a larger Hispanic population than the United States (46.9 million).
Source: International Data Base http://www.census.gov/ipc/nas/content/live/hispanic/idbsum.html and population estimates http://www.census.gov/Press-Release/nas/content/live/hispanic/releases/archives/population/013733.html
64%
The percentage of Hispanic-origin people in the United States who were of Mexican background in 2007. Another 9 percent were of Puerto Rican background, with 3.5 percent Cuban, 3.1 percent Salvadoran and 2.7 percent Dominican. The remainder were of some other Central American, South American or other Hispanic or Latino origin.
About 45 percent of the nation’s Dominicans lived in New York City in 2007 and about half of the nation’s Cubans in Miami-Dade County, Fla.
Source: 2007 American Community Survey http://www.census.gov/acs/nas/content/live/hispanic/Products/users_guide/index.htm
25%
Percentage of children younger than 5 who were Hispanic in 2008. All in all, Hispanics comprised 22 percent of children younger than 18.
Source: Population estimates http://www.census.gov/Press-Release/nas/content/live/hispanic/releases/archives/population/013733.html
27.7 years
Median age of the Hispanic population in 2008. This compared with 36.8 years for the population as a whole.
Source: Population estimates http://www.census.gov/Press-Release/nas/content/live/hispanic/releases/archives/population/013733.html
107
Number of Hispanic males in 2008 per every 100 Hispanic females. This was in sharp contrast to the overall population, which had 97 males per every 100 females.
Source: Population estimates http://www.census.gov/Press-Release/nas/content/live/hispanic/releases/archives/population/013733.html
States and Counties
48%
The percentage of the Hispanic-origin population that lived in California or Texas in 2008. California was home to 13.5 million Hispanics, and Texas was home to 8.9 million.
Source: Population estimates http://www.census.gov/Press-Release/nas/content/live/hispanic/releases/archives/population/013734.html
16
The number of states with at least a half-million Hispanic residents — Arizona, California, Colorado, Florida, Georgia, Illinois, Massachusetts, Nevada, New Jersey, New Mexico, New York, North Carolina, Pennsylvania, Texas, Virginia and Washington.
Source: Population estimates http://www.census.gov/Press-Release/nas/content/live/hispanic/releases/archives/population/013734.html
45%
The percentage of New Mexico’s population that was Hispanic in 2008, the highest of any state. Hispanics also made up at least one fifth of the population in California and Texas, at 37 percent each, Arizona (30 percent), Nevada (26 percent), Florida (21 percent) and Colorado (20 percent). New Mexico had 891,000 Hispanics.
Source: Population estimates http://www.census.gov/Press-Release/nas/content/live/hispanic/releases/archives/population/013734.html
The Carolinas
The states with the highest percentage increases in Hispanic population between July 1, 2007, and July 1, 2008. South Carolina’s increase was 7.7 percent and North Carolina’s was 7.4 percent.
Source: Population estimates http://www.census.gov/Press-Release/nas/content/live/hispanic/releases/archives/population/013734.html
4.7 million
The Hispanic population of Los Angeles County, Calif., in 2008 — the largest of any county in the nation. Los Angeles County also had the biggest numerical increase in the Hispanic population (67,000) since July 2007.
Source: Population estimates http://www.census.gov/Press-Release/nas/content/live/hispanic/releases/archives/population/013734.html
97%
Proportion of the population of Starr County, Texas, that was Hispanic as of 2008, which led the nation. All of the top 10 counties in this category were in Texas.
Source: Population estimates http://www.census.gov/Press-Release/nas/content/live/hispanic/releases/archives/population/013734.html
48
Number of the nation’s 3,142 counties that are majority-Hispanic.
Source: Population estimates http://www.census.gov/Press-Release/nas/content/live/hispanic/releases/archives/population/013734.html
15%
Percent increase in the Hispanic population in Luzerne County, Pa., from July 1, 2007, to July 1, 2008. Among all counties with 2007 Hispanic populations of at least 10,000, Luzerne topped the nation in this category. Luzerne’s county seat is Wilkes-Barre.
Source: Population estimates http://www.census.gov/Press-Release/nas/content/live/hispanic/releases/archives/population/013734.html
313,000
The increase in California’s Hispanic population between July 1, 2007, and July 1, 2008, which led all states. Texas (305,000) and Florida (111,000) also recorded large increases.
Source: Population estimates http://www.census.gov/Press-Release/nas/content/live/hispanic/releases/archives/population/013734.html
20
Number of states in which Hispanics are the largest minority group. These states are Arizona, California, Colorado, Connecticut, Florida, Idaho, Iowa, Kansas, Massachusetts, Nebraska, Nevada, New Hampshire, New Jersey, New Mexico, Oregon, Rhode Island, Texas, Utah, Washington and Wyoming.
Source: Population estimates http://www.census.gov/Press-Release/nas/content/live/hispanic/releases/archives/population/013734.html
Nearly 43 percent of Hispanic-owned firms operated in construction; administrative and support, and waste management and remediation services; and other services, such as personal services, and repair and maintenance. Retail and wholesale trade accounted for nearly 36 percent of Hispanic-owned business revenue.
Counties with the highest number of Hispanic-owned firms were Los Angeles County (188,422); Miami-Dade County (163,187); and Harris County, Texas (61,934).
Triple
The rate of growth of Hispanic-owned businesses between 1997 and 2002 (31 percent) compared with the national average (10 percent) for all businesses.
$222 billion
Revenue generated by Hispanic-owned businesses in 2002, up 19 percent from 1997.
44.6%
…of all Hispanic-owned firms were owned by people of Mexican origin (Mexican, Mexican-American or Chicano).
29,168
Number of Hispanic-owned firms with receipts of $1 million or more.
Families and Children
10.4 million
The number of Hispanic family households in the United States in 2008. Of these households, 62 percent included children younger than 18.
Source: Families and Living Arrangements http://www.census.gov/Press-Release/nas/content/live/hispanic/releases/archives/families_households/013378.html
66%
The percentage of Hispanic family households consisting of a married couple.
Source: Families and Living Arrangements http://www.census.gov/Press-Release/nas/content/live/hispanic/releases/archives/families_households/013378.html
43%
The percentage of Hispanic family households consisting of a married couple with children younger than 18.
Source: Families and Living Arrangements http://www.census.gov/Press-Release/nas/content/live/hispanic/releases/archives/families_households/013378.html
70%
Percentage of Hispanic children living with two parents.
Source: Families and Living Arrangements http://www.census.gov/Press-Release/nas/content/live/hispanic/releases/archives/families_households/013378.html
Spanish Language
35 million
The number of U.S. residents 5 and older who spoke Spanish at home in 2007. Those who hablan espanol constituted 12 percent of U.S. residents. More than half of these Spanish speakers spoke English “very well.”
Number of states where at least one-in-five residents spoke Spanish at home in 2007 — Arizona, California, New Mexico and Texas.
Source: 2007 American Community Survey http://www.census.gov/Press-Release/nas/content/live/hispanic/releases/archives/american_community_survey_acs/012634.html
78%
Percentage of Hispanics 5 and older who spoke Spanish at home in 2007.
The median income of Hispanic households in 2007, statistically unchanged from the previous year after adjusting for inflation.
Source: Income, Poverty, and Health Insurance Coverage in the United States: 2007 http://www.census.gov/Press-Release/nas/content/live/hispanic/releases/archives/income_wealth/012528.html
21.5%
The poverty rate among Hispanics in 2007, up from 20.6 percent in 2006.
Source: Income, Poverty, and Health Insurance Coverage in the United States: 2007 http://www.census.gov/Press-Release/nas/content/live/hispanic/releases/archives/income_wealth/012528.html
32.1%
The percentage of Hispanics who lacked health insurance in 2007, down from 34.1 percent in 2006.
Source: Income, Poverty, and Health Insurance Coverage in the United States: 2007 http://www.census.gov/Press-Release/nas/content/live/hispanic/releases/archives/income_wealth/012528.html
Education
53%
The percentage of Hispanic 4-year-olds enrolled in nursery school in 2007, up from 43 percent in 1997 and 21 percent in 1987.
The percentage of Hispanics 25 and older who had at least a high school education in 2008.
Source: Educational Attainment in the United States: 2008 http://www.census.gov/Press-Release/nas/content/live/hispanic/releases/archives/education/013618.html
13%
The percentage of the Hispanic population 25 and older with a bachelor’s degree or higher in 2008.
Source: Educational Attainment in the United States: 2008 http://www.census.gov/Press-Release/nas/content/live/hispanic/releases/archives/education/013618.html
3.6 million
The number of Hispanics 18 and older who had at least a bachelor’s degree in 2008.
Source: Educational Attainment in the United States: 2008 http://www.census.gov/Press-Release/nas/content/live/hispanic/releases/archives/education/013618.html
1 million
Number of Hispanics 25 and older with advanced degrees in 2008 (e.g., master’s, professional, doctorate).
Source: Educational Attainment in the United States: 2008 http://www.census.gov/Press-Release/nas/content/live/hispanic/releases/archives/education/013618.html
12%
Percentage of full-time college students (both undergraduate and graduate students) in October 2007 who were Hispanic, up from 10 percent in 2006.
Source: School Enrollment – Social and Economic Characteristics of Students: October 2007 http://www.census.gov/Press-Release/nas/content/live/hispanic/releases/archives/education/013391.html
20%
Percentage of elementary and high school students combined who were Hispanic.
Source: School Enrollment – Social and Economic Characteristics of Students: October 2007 http://www.census.gov/Press-Release/nas/content/live/hispanic/releases/archives/education/013391.html
Names
4
The number of Hispanic surnames ranked among the 15 most common in 2000. It was the first time that a Hispanic surname reached the top 15 during a census. Garcia was the most frequent Hispanic surname, occurring 858,289 times and placing eighth on the list — up from 18th in 1990. Rodriguez (ninth), Martinez (11th) and Hernandez (15th) were the next most common Hispanic surnames.
Source: Census 2000 Genealogy http://www.census.gov/genealogy/nas/content/live/hispanic/freqnames2k.html
Jobs
67%
Percentage of Hispanics 16 and older who were in the civilian labor force in 2007.
Source: 2007 American Community Survey http://www.census.gov/acs/nas/content/live/hispanic/Products/users_guide/index.htm
18%
The percentage of Hispanics 16 or older who worked in management, professional and related occupations in 2007. The same percentage worked in production, transportation and material moving occupations. Another 16 percent worked in construction, extraction, maintenance and repair occupations. Approximately 24 percent of Hispanics 16 or older worked in service occupations; 21 percent in sales and office occupations; and 2 percent in farming, fishing and forestry occupations.
Source: 2007 American Community Survey http://www.census.gov/acs/nas/content/live/hispanic/Products/users_guide/index.htm
79,400
Number of Hispanic chief executives. In addition, 50,866 physicians and surgeons; 48,720 postsecondary teachers; 38,532 lawyers; and 2,726 news analysts, reporters and correspondents are Hispanic.
Source: Upcoming Statistical Abstract of the United States: 2010, Table 603 http://www.census.gov/compendia/statab/
Voting
5.6 million
The number of Hispanic citizens who reported voting in the 2006 congressional elections. The percentage of Hispanic citizens voting — about 32 percent — did not change statistically from four years earlier.
Source: Voting and Registration in the Election of November 2006 http://www.census.gov/Press-Release/nas/content/live/hispanic/releases/archives/voting/012234.html
Serving our Country
1.1 million
The number of Hispanic veterans of the U.S. armed forces.
Source: 2007 American Community Survey http://www.census.gov/acs/nas/content/live/hispanic/Products/users_guide/index.htm
Following is a list of observances typically covered by the Census Bureau’s Facts for Features series:
African-American History Month (February) Labor Day
Super Bowl Grandparents Day
Valentine’s Day (Feb. 14) Hispanic Heritage Month
Women’s History Month (March) (Sept. 15-Oct. 15)
Irish-American Heritage Month (March)/ Unmarried and Single
St. Patrick’s Day (March 17) Americans Week
Asian/Pacific American Heritage Month (May) Halloween (Oct. 31)
Older Americans Month (May) American Indian/Alaska
Cinco de Mayo (May 5) Native Heritage Month
Mother’s Day (November)
Father’s Day Veterans Day (Nov. 11)
The Fourth of July (July 4) Thanksgiving Day
Anniversary of Americans with The Holiday Season
Disabilities Act (July 26) (December)
Back to School (August)
Editor’s note: The preceding data were collected from a variety of sources and may be subject to sampling variability and other sources of error. Facts for Features are customarily released about two months before an observance in order to accommodate magazine production timelines. Questions or comments should be directed to the Census Bureau’s Public Information Office: telephone: 301-763-3030; fax: 301-763-3762; or e-mail: pio@census.gov.
Source: U.S. Census Bureau
The nation’s largest minority group controlled $686 billion in spending in 2004, the University of Georgia’s Selig Center for Economic Growth concluded, and the Hispanic purchasing power comprises the world’s ninth biggest economy. It’s larger than the GNP of Brazil, Spain or Mexico, reported the Hispanic Association on Corporate Responsibility. Hispanic purchasing power is projected to reach as much as $1 trillion by next year (2010).
The main drivers of the surge in Hispanic consumer influence are education levels, labor force composition, household characteristics and accumulation of wealth.
Advertising expenditures aimed at U.S. Hispanics have grown while the overall ad market has slowed down. From 2000-2004, Latino-directed budgets from the top 50 advertisers rose from $658 million to $1.23 billion, or 87%. Major players such as Procter & Gamble, General Motors, McDonald’s and Coca-Cola have continually increased the amount they spend to reach this coveted market, which is becoming more desirable in terms of sheer numbers and economic clout.
• U.S. Hispanic purchasing power posted a compound annual growth rate of 7.7%
• Higher paying managerial and professional jobs are the fastest-growing occupational categories for Hispanics
• California and Texas account for more than 34 percent of all Hispanic purchasing power and nearly half of the entire U.S. Hispanic population
Source: TIA
https://hispanic-marketing.com/wp-content/uploads/2014/09/targetlatino-enfold-logo1.png00Havi Goffanhttps://hispanic-marketing.com/wp-content/uploads/2014/09/targetlatino-enfold-logo1.pngHavi Goffan2009-07-17 16:31:402018-03-27 05:04:56Hispanic Purchasing Power is world’s 9th biggest economy
The younger, hipper Hispanic target is most likely native-born in the US and differs greatly in their consumer behavior from older/immigrant Hispanics – they speak English fluently and tend to be familiar with main-stream American culture and have similar buying habits to whites, AA and other non-Hispanics.
The Younger, Hipper Hispanic
Young blacks and Hispanic college graduates are reviving cities. They live in funky row houses and apartments in old neighborhoods that have been spruced up. They’re part of the ‘Bohemian Mix,’ a cluster that has a substantial percentage of blacks and Hispanics. It’s the most affluent of the racially and ethnically diverse groups. Bohemians socialize across racial lines, jog, shop at Banana Republic, read Vanity Fair, watch Friends and drive Audis.
Of note regarding youth in general: “Youth Digerati” (as opposed to the old nickname “Youth Literati”), an ethnically mixed group, is the most affluent urban cluster. Young Digerati tend to live in fashionable neighborhoods and are now more affluent than “Money & Brains” – older professional couples who have few children and own homes in upscale city neighborhoods.
Source: TIA
Hispanics are entering cyberspace more quickly than other ethnic groups – Internet use jumped 7.4 percent in 2004 after an 8 percent spurt in 2003. The typical Hispanic-American Internet user is age 28, slightly more likely to be male and unmarried, according to a study by the Association of Hispanic Advertising Agencies. Half of all Hispanic-American Internet users are Spanish-language dominant, meaning that they speak Spanish at home more than English (Preparer’s Note: this could be attributed to their family-oriented lifestyle and may not necessarily affect the way younger Hispanics use the Internet).
This particular study found that the profile of Hispanics Online is:
• Hispanics spend almost 5-1/2 hours online weekly
• 71 percent of their usage is from a home computer
• 75% use the Internet for email
• 60% to get news
• 54% to listen to music
• 43% to chat
A March 2004 study by AOL/Roper ASW shows that 14 million Hispanics in the US are online. While this is already an impressive number, the growth rate is even more impressive. About 20% of online Hispanics had connected their households to the Internet less than six months earlier. More than half who were not yet online expected to connect within the next two years. The more Latinos connect online, the less time they spend with other Spanish media, such as print or TV. Marketers will increasingly want to reflect this shift in media consumption in their advertising budgets.
https://hispanic-marketing.com/wp-content/uploads/2015/05/Uncovered-Facts-About-Online-Hispanic-Women-and-their-Media-Usage.jpg768650Havi Goffanhttps://hispanic-marketing.com/wp-content/uploads/2014/09/targetlatino-enfold-logo1.pngHavi Goffan2015-05-18 15:47:292023-04-20 16:21:07Uncovered Facts About Online Hispanic Women and their Media Usage
https://hispanic-marketing.com/wp-content/uploads/2010/12/elianneramos.jpg302361Havi Goffanhttps://hispanic-marketing.com/wp-content/uploads/2014/09/targetlatino-enfold-logo1.pngHavi Goffan2010-12-15 09:23:542018-03-29 00:03:56Why Marketers Should Care About Reaching Latina Bloggers
https://hispanic-marketing.com/wp-content/uploads/2010/12/never-lose-your-sense-of-wonder.jpg1028570Havi Goffanhttps://hispanic-marketing.com/wp-content/uploads/2014/09/targetlatino-enfold-logo1.pngHavi Goffan2010-12-10 11:59:482018-03-28 21:12:22Target Latino gives the gift of WOM this holiday season
https://hispanic-marketing.com/wp-content/uploads/2010/01/box.jpg350400Havi Goffanhttps://hispanic-marketing.com/wp-content/uploads/2014/09/targetlatino-enfold-logo1.pngHavi Goffan2010-01-20 11:33:382018-03-28 04:33:31Hispanics social media marketing strategy – a must
Source: TIA
https://hispanic-marketing.com/wp-content/uploads/2009/07/internetstudy.jpg388620Havi Goffanhttps://hispanic-marketing.com/wp-content/uploads/2014/09/targetlatino-enfold-logo1.pngHavi Goffan2009-07-16 11:01:592018-05-18 19:40:07Profile of Hispanics Online
We may request cookies to be set on your device. We use cookies to let us know when you visit our websites, how you interact with us, to enrich your user experience, and to customize your relationship with our website.
Click on the different category headings to find out more. You can also change some of your preferences. Note that blocking some types of cookies may impact your experience on our websites and the services we are able to offer.
Essential Website Cookies
These cookies are strictly necessary to provide you with services available through our website and to use some of its features.
Because these cookies are strictly necessary to deliver the website, refusing them will have impact how our site functions. You always can block or delete cookies by changing your browser settings and force blocking all cookies on this website. But this will always prompt you to accept/refuse cookies when revisiting our site.
We fully respect if you want to refuse cookies but to avoid asking you again and again kindly allow us to store a cookie for that. You are free to opt out any time or opt in for other cookies to get a better experience. If you refuse cookies we will remove all set cookies in our domain.
We provide you with a list of stored cookies on your computer in our domain so you can check what we stored. Due to security reasons we are not able to show or modify cookies from other domains. You can check these in your browser security settings.
Google Analytics Cookies
These cookies collect information that is used either in aggregate form to help us understand how our website is being used or how effective our marketing campaigns are, or to help us customize our website and application for you in order to enhance your experience.
If you do not want that we track your visit to our site you can disable tracking in your browser here:
Other external services
We also use different external services like Google Webfonts, Google Maps, and external Video providers. Since these providers may collect personal data like your IP address we allow you to block them here. Please be aware that this might heavily reduce the functionality and appearance of our site. Changes will take effect once you reload the page.
Google Webfont Settings:
Google Map Settings:
Google reCaptcha Settings:
Vimeo and Youtube video embeds:
Other cookies
The following cookies are also needed - You can choose if you want to allow them:
Privacy Policy
You can read about our cookies and privacy settings in detail on our Privacy Policy Page.

 https://hispanic-marketing.com/wp-content/uploads/2011/02/2011-unauthorized-immigration-01.png
465
484
Havi Goffan
https://hispanic-marketing.com/wp-content/uploads/2014/09/targetlatino-enfold-logo1.png
Havi Goffan2011-02-01 12:18:262018-03-27 00:52:03Unauthorized Immigrant Population: National and State Trends
https://hispanic-marketing.com/wp-content/uploads/2011/02/2011-unauthorized-immigration-01.png
465
484
Havi Goffan
https://hispanic-marketing.com/wp-content/uploads/2014/09/targetlatino-enfold-logo1.png
Havi Goffan2011-02-01 12:18:262018-03-27 00:52:03Unauthorized Immigrant Population: National and State Trends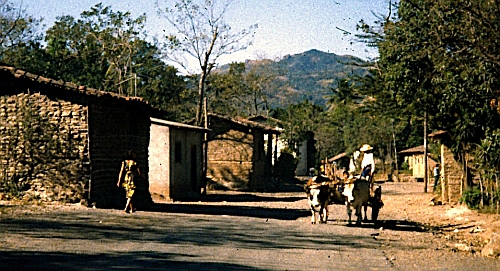 https://hispanic-marketing.com/wp-content/uploads/2010/05/el-salvador.jpg
271
500
Havi Goffan
https://hispanic-marketing.com/wp-content/uploads/2014/09/targetlatino-enfold-logo1.png
Havi Goffan2010-05-26 09:49:512018-03-28 05:34:46Let’s talk about Salvadorans
https://hispanic-marketing.com/wp-content/uploads/2010/05/el-salvador.jpg
271
500
Havi Goffan
https://hispanic-marketing.com/wp-content/uploads/2014/09/targetlatino-enfold-logo1.png
Havi Goffan2010-05-26 09:49:512018-03-28 05:34:46Let’s talk about Salvadorans https://hispanic-marketing.com/wp-content/uploads/2010/05/cuba.jpg
315
600
Havi Goffan
https://hispanic-marketing.com/wp-content/uploads/2014/09/targetlatino-enfold-logo1.png
Havi Goffan2010-05-18 09:38:412018-03-28 05:36:17Have you heard about Cubans?
https://hispanic-marketing.com/wp-content/uploads/2010/05/cuba.jpg
315
600
Havi Goffan
https://hispanic-marketing.com/wp-content/uploads/2014/09/targetlatino-enfold-logo1.png
Havi Goffan2010-05-18 09:38:412018-03-28 05:36:17Have you heard about Cubans?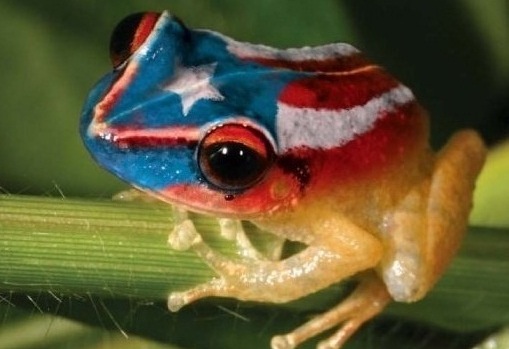 https://hispanic-marketing.com/wp-content/uploads/2010/05/PuertoRicanCoqui.jpg
349
509
Havi Goffan
https://hispanic-marketing.com/wp-content/uploads/2014/09/targetlatino-enfold-logo1.png
Havi Goffan2010-05-17 09:06:042018-03-28 05:37:00What are Puerto Ricans like?
https://hispanic-marketing.com/wp-content/uploads/2010/05/PuertoRicanCoqui.jpg
349
509
Havi Goffan
https://hispanic-marketing.com/wp-content/uploads/2014/09/targetlatino-enfold-logo1.png
Havi Goffan2010-05-17 09:06:042018-03-28 05:37:00What are Puerto Ricans like? https://hispanic-marketing.com/wp-content/uploads/2010/03/1104507_mobile_phone.jpg
300
225
Havi Goffan
https://hispanic-marketing.com/wp-content/uploads/2014/09/targetlatino-enfold-logo1.png
Havi Goffan2010-04-07 09:08:462019-08-13 04:13:54How Young Latinos Come of Age in America
https://hispanic-marketing.com/wp-content/uploads/2010/03/1104507_mobile_phone.jpg
300
225
Havi Goffan
https://hispanic-marketing.com/wp-content/uploads/2014/09/targetlatino-enfold-logo1.png
Havi Goffan2010-04-07 09:08:462019-08-13 04:13:54How Young Latinos Come of Age in America